
Results 1 to 6 of 6
-
30-04-2006, 03:56 AM #1
 Registered User
Hey, I am new to : RE
Registered User
Hey, I am new to : RE

- Join Date
- Jan 2006
- Location
- Ontario
- Posts
- 9
- Rep Power
- 0
Chart for the "whys of conditions?
I am looking for a simple chart on the conditions and hows and whys of the results.
For instance:
TEV valve too restrictive. Super heat goes up because there is more vapor in the evaporator and more sensible heat transfer and less latent heat transfer.(I think that's right)
I am in school yet and and still trying to get it straight in my head.
It is a marine engineering school and refrigeration is just a component and we dont seem to have many resources.
Does such a "chart" exist.
Thanks
-
30-04-2006, 07:56 AM #2
 Moderator
Site Moderator : and general nice guy
Moderator
Site Moderator : and general nice guy

- Join Date
- Oct 2003
- Location
- Belgium
- Age
- 62
- Posts
- 5,630
- Rep Power
- 34
Re: Chart for the "whys of conditions?
These charts excists but I think you're using already a much better technique right now: trying to understand why something happens and what the consequences are of this.
This is far better then using charts.
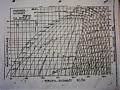
Your avatar is a log/p Chart and if you understand this completely and can use it in a real life situation, then you can solve many practical problems.
On your chart, a too small TEV, what will it do you think?
But I will try to find them for you: I have some from Danfoss but theyr're in Dutch.
I will look but in the meantime, others will perhaps post some helpfull information for you.It's better to keep your mouth shut and give the impression that you're stupid than to open it and remove all doubt.
-
30-04-2006, 10:36 AM #3
 Super Moderator
- Join Date
- Oct 2001
- Location
- Nottingham UK
- Posts
- 5,668
- Rep Power
- 51
Re: Chart for the "whys of conditions?
Download these documents and read them - they explain the TEV operation in great detail, even the answer you are looking for
 http://www.sporlan.com/tevs.shtm
-
30-04-2006, 12:00 PM #4
 Moderator
Site Moderator : and general nice guy
Moderator
Site Moderator : and general nice guy
- Join Date
- Jan 2006
- Location
- Croatia
- Age
- 68
- Posts
- 2,263
- Rep Power
- 31
Re: Chart for the "whys of conditions?
Helo Frankiee,
welcome on board,
visit this page:
http://www.danfoss.com/Asean/Busines...on+University/
and start from begining, hope you'll enjoy
Best regards,
Josip
It's impossible to make anything foolproof because fools are so ingenious...
Don't ever underestimate the power of stupid people when they are in large groups.
Please, don't teach me how to be stupid....
No job is as important as to jeopardize the safety of you or those that you work with.
-
30-04-2006, 04:32 PM #5
 VIP Poster
- Join Date
- Aug 2005
- Location
- USA
- Posts
- 5,302
- Rep Power
- 25
Re: Chart for the "whys of conditions?
HI Josip,
That was a very good site. Thank you for sharing this.
-
30-04-2006, 09:26 PM #6
 Moderator
I am starting to push the Mods: of RE Site Moderator : and general nice guy
Moderator
I am starting to push the Mods: of RE Site Moderator : and general nice guy
- Join Date
- Mar 2001
- Location
- Dorset
- Age
- 76
- Posts
- 11,025
- Rep Power
- 60
Re: Chart for the "whys of conditions?
It has to be said that Danfoss ceertainly do invest some time in their presentations.
Brian - Newton Abbot, Devon, UK
Retired March 2015

Similar Threads
-
New person says hi and looks for p/h chart for R-12
By frankiee in forum FundamentalsReplies: 11Last Post: 24-02-2010, 12:57 PM -
New person says hi and is looking for a p/h chart for R-12
By frankiee in forum RefrigerantsReplies: 12Last Post: 20-01-2006, 12:26 PM
