
Results 1 to 11 of 11
Thread: P & I Diagram for Central Plant
-
24-06-2008, 10:14 AM #1

 VIP Poster

- Join Date
- May 2007
- Location
- India
- Posts
- 688
- Rep Power
- 17
P & I Diagram for Central Plant
Though all are used to prepare the P & I Diagrams, ( generally based on some old diagrams etc.) , What is the correct way of doing things?
We came across one Consultant from UK & he had laid some basic principles.
1. Show the Equipments almost close to the actual installation in P & ID. Those may not be dimensionally matching , but locations should be clear enough for the site persons for doing the project eventually.
2. Show Reducers etc on the pipings. The Bends etc may not be feasible to show, but Reducers can be definitely added.
3. Work out the vessel sizes from theory & do not follow some catalog's for selection the vessel if possible.
4. Make it as much clear as much possible showing all details.
There must be similar points from others.
I could check few P & ID from Europe, & these points were not followed.
Even in Our P& ID many of the times these points are missing.
-
24-06-2008, 01:45 PM #2
 VIP Poster
- Join Date
- Aug 2005
- Location
- USA
- Posts
- 5,302
- Rep Power
- 25
Re: P & I Diagram for Central Plant
Here's a link to an article I wrote last year on the subject. It is a short article, but addresses some of the topics you are asking about.
http://www.coldsystemsllc.com/concepts/pid-jan2007.pdfIf all else fails, ask for help.
-
25-06-2008, 05:39 AM #3
VIP Poster
- Join Date
- May 2007
- Location
- India
- Posts
- 688
- Rep Power
- 17
Re: P & I Diagram for Central Plant
Yes it is a very good article.
-
25-06-2008, 03:07 PM #4
VIP Poster
- Join Date
- Aug 2005
- Location
- USA
- Posts
- 5,302
- Rep Power
- 25
Re: P & I Diagram for Central Plant
The issue with P&ID's is that a lot of people have never done one before, so they don't know what the requirements are. That is not a commentary on anyone's ability. This is just a difficult topic.
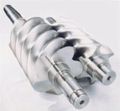
First and foremost I feel a P&ID should show every valve, instrument, pipe, or control tubing run on any one component. Most people show a compressor as a picture with a suction and discharge line attached. Anyone who has seen a screw compressor package will realize there is a lot more to showing the instrumentation and piping than what typically is shown on many common P&ID's.
I like to have the main component (say a vessel) to have a specific tag number. Let's use a tag number of V-100 as an example. This simply shows the vessel has a unique number in some sequence of other vessels.
I usually label the inlet service (or block) valves as SV-100, which denotes service valve 100 as the valve controlling the flow into the vessel. The outlet block valve is labeled as SV-101. Using this method someone looking at the drawing will see that any valve with a number of -100 is an inlet valve, while any valve labeled -101 is the outlet valve. You can do the same thing for any major component so that this contributes to easier comprehension & learning for the people. It helps them to become intuitive with the system operation.
To continue the logic I use, any valve associated with this same vessel would continue to use the same numbering sequence. You can label the Pressure Relief Valves as PRV-100 & PRV-101, while the main three-way valve under the reliefs is called SV-103. SV-103 is a main valve such as the -100 & -101 valves are.
The way I view this method is: The main valves on any component should have a similar format so that anytime someone sees a valve on a drawing they can instantly tell it's purpose.
If you develop and follow a system that makes sense then after sometime each drawing you do someone will be able to pick it up and fully understand exactly what it means, where the valves are at, and what they do.
It's also possible to show the basic orientation of piping if the drawing is carefully laid out. If the flow is down by gravity show that on the drawing. If the flow is supposed to enter on the top of the main header show that. If the flow comes off of the bottom of a pipe, then show it that way. Some will simply take the pipe off of the bottom of the line because it is easier to show on the drawing, but it's confusing to read and does not help to instruct how the piping is designed or what is required.
Too many people try to place too much information on a single sheet. Spread out the information onto multiple sheets if need be. I have worked on systems where the single P&ID for a screw compressor took an entire sheet.
You can draw all the air-cooling evaporators for one room on a single sheet. Then you have sufficient area to place the necessary information for that room. Place the line continuation markers at a common location on the sheets and identify what they are for and where they go to the next sheet.
Use a pipe code to identify size, wall thickness, material, etc. For example: 3-40-CS-B106 might be used to show the pipe is 3" nominal diameter with a Schedule 40 wall thickness in a carbon steel material of a grade B and seamless. That's useful information to have and during design this is easy to do. Not so easy after the job is finished...
And... it helps to develop a block flow diagram so that you can follow the process quickly from point A to point B. This can be a single line drawing only.
Hope this helps...
Last edited by US Iceman; 25-06-2008 at 03:12 PM. Reason: spelling
If all else fails, ask for help.
-
26-06-2008, 05:57 AM #5
VIP Poster
- Join Date
- May 2007
- Location
- India
- Posts
- 688
- Rep Power
- 17
Re: P & I Diagram for Central Plant
Dear Us ICEMAN,
Many thanks for the detailed reply. We too do similar things, but there is always a scope for improvement.
We shall take cognisance of these points in future.
-
26-06-2008, 02:23 PM #6
VIP Poster
- Join Date
- Aug 2005
- Location
- USA
- Posts
- 5,302
- Rep Power
- 25
Re: P & I Diagram for Central Plant
If you think about the P&ID's conveying information about the refrigeration system then you see the issue of trying to put as much information as possible on the drawings.
One thing I also do is to put a schedule of the equipment on each sheet. In this schedule you can put some of the basic performance data for the components next to the tag numbers and basic descriptions.
What I like to see is this; when I pick up a P&ID I want to be able to learn as much about the system as I can. All of this information is available during design, which is a good time to do this.
When you see a P&ID that has pretty pictures of a side view of a screw compressor package you know a lot of the details are missing. This is just a pet peeve of mine. I don't mean to be lecturing anyone...
If all else fails, ask for help.
-
05-07-2008, 03:52 AM #7
Veteran Poster
- Join Date
- Sep 2006
- Location
- Venezuela
- Posts
- 259
- Rep Power
- 18
Re: P & I Diagram for Central Plant
Hi smpsmp45
we use also a code for the equipements and we related all the instrumentation to the equipment
The Ammoniac trap has the code XX for instance
Then a pressure indicator has the XX PI 001 and a relive valve for the ammonia trap is XX PRV 001
It is very helfully for a main central control
Regards
Gwapa
-
05-07-2008, 06:21 AM #8
VIP Poster
- Join Date
- May 2007
- Location
- India
- Posts
- 688
- Rep Power
- 17
Re: P & I Diagram for Central Plant
I think on this forum we should come together to form the basic guidelines for P & ID based on these inputs.
US ICEman had sent a paper earlier written by him. Now we need to extrapolate on that further.
-
06-07-2008, 03:16 AM #9
VIP Poster
- Join Date
- Aug 2005
- Location
- USA
- Posts
- 5,302
- Rep Power
- 25
Re: P & I Diagram for Central Plant
That's the sort of logic I like. The tag relates to the specific component, the valve itself, and a unique number. Having the instrument tags arranged with this or a similar order helps to provide information on the control addresses for ease of location also. Originally Posted by gwapa
I also like to see something for the control loops on the drawings. For example: a float switch controls a liquid line solenoid valve. A solid line connecting the float switch and solenoid shows the two are related in function. It's also common to use a different symbol for local or remote mounted instrumentation.
The amount of information you can read from a well developed P&ID is worthwhile to help understand the system.
If all else fails, ask for help.
-
07-07-2009, 08:24 AM #10
 regular poster
- Join Date
- Mar 2007
- Location
- UAE
- Age
- 43
- Posts
- 78
- Rep Power
- 18
Re: P & I Diagram for Central Plant
Here's a link to an article I wrote last year on the subject. It is a short article, but addresses some of the topics you are asking about.
http://www.coldsystemsllc.com/concepts/pid-jan2007.pdf
Dear sir,
Can you pls send this file to my following id:
jkumar@fanargroup.ae
-
14-08-2009, 08:30 PM #11
Twotone Guest
Re: P & I Diagram for Central Plant
The article link in no longer working. How may I get a copy to read?

Similar Threads
-
Single stage refrigeration system optimizing diagram
By autt in forum System OptimizationReplies: 34Last Post: 03-12-2008, 03:13 PM -
Tube Ice Plant -Ammonia
By tjk2007 in forum IndustrialReplies: 3Last Post: 25-04-2008, 09:41 PM -
Refrigeration plant Hydro test
By psrao in forum New TechnologiesReplies: 17Last Post: 09-04-2008, 12:05 AM -
Soap Plant Load Calculations
By tjk2007 in forum FundamentalsReplies: 0Last Post: 25-11-2007, 05:59 AM -
project of refrigeration plant
By gesi in forum FundamentalsReplies: 5Last Post: 12-06-2006, 07:13 AM
